RAC Commands

Shutdown and Start sequence steps of Oracle RAC components

How to stop Oracle RAC (11g, 12c)?

You must perform these steps in the order listed to stop Oracle RAC:

  1. emctl stop dbconsole (11c only. In 12c DB Express replaces dbconsole and doesn’t have to be stopped )
  2. srvctl stop listener [-listener listener_name] [-node node_name] [-force] (stops all listener services)
  3. srvctl stop database -db db_unique_name [-stopoption stop_options] [-eval(12c only)] [-force] [-verbose]
  4. srvctl stop asm [-proxy] [-node node_name] [-stopoption stop_options] [-force]
  5. srvctl stop nodeapps [-node node_name] [-gsdonly] [-adminhelper] [-force] [-relocate] [-verbose]
  6. crsctl stop crs

How to Start Oracle RAC (11g, 12c)?

You must perform these steps in the order listed to start Oracle RAC:

1. crsctl start crs
2. crsctl start res ora.crsd -init
3. srvctl start nodeapps [-node node_name] [-gsdonly] [-adminhelper] [-verbose]
4. srvctl start asm [-proxy] [-node node_name [-startoption start_options]]
5. srvctl start database -db db_unique_name [-eval(12c only)]] [-startoption start_options] [-node node_name]
6. srvctl start listener [-node node_name] [-listener listener_name] (start all listener services)
7. emctl start dbconsole (11c only)

To start resources  of your HA environment if that are still down(e.g. ora.ons, Listener):
crsctl start resource -all

DEBUG

Starting with Oracle 12c, the log and trace files of the clusterware files are stored in the Automatic Diagnostic Repository (ADR) under the ADR_HOME location $ADR_BASE/diag/crs/`hostname`/crs.

$ adrci
adrci> show homes

Cluster resources: CRS, HAS and cluster

How to display the status of resources in RAC?

Clusterware Resource Status Check : crsctl status resource -t (or shorter: crsctl stat res -t)

crsctl status resource -t (or shorter: crsctl stat res -t)

Find offline resources: crs_stat -t | grep -i offline

How to check the current status of a cluster?

crsctl check cluster
CRS-4537: Cluster Ready Services is online
CRS-4529: Cluster Synchronization Services is online
CRS-4533: Event Manager is online

To know the cluster name: olsnodes -c

How to check the current status of CRS?

crsctl check crs
CRS-4638: Oracle High Availability Services is online (has)
CRS-4537: Cluster Ready Services is online (crs)
CRS-4529: Cluster Synchronization Services is online (css)
CRS-4533: Event Manager is online

How to Stop/Start the local node?

crsctl stop has
This command will also abort the database and CRS. Local Listeners will stop and VIP listeners will migrate elsewhere.

crsctl start has
This command will start all the CRS components, listeners and the database.

How to Stop/Start the whole cluster?

crsctl stop cluster -all
crsctl start cluster -all

How to To start and stop oracle clusterware (CRS)?

crsctl stop crs
crsctl start crs

Manage Network components


How to display global public and global cluster_interconnect?

C:\Windows\system32>oifcfg ge34f
Heartbeat 194.56.67.0 global cluster_interconnect,asm
Production 10.356.3.0 global public

How to check if nodeapps running on a node?

srvctl status nodeapps [-n my-node]
For each VIP address: network enabled/disabled, running on node host1 or not running.

Nodeapps are standard set of oracle application services which are started automatically for RAC.
Node apps Include:
1) VIP
2) Oracle Net listeners
3) Global Service Daemon
4) Oracle Notification Service (ONS).

Nodeapp Services run on each node of the cluster. They switch over to other nodes through VIP during a failover.

How to check the SCAN Configuration?

The SCAN makes it possible to add or remove nodes from the cluster without needing to reconfigure clients.

Using CLUVFY to Confirm DNS is Correctly Associating the SCAN addresses.

cluvfy comp scan
Verifying Single Client Access Name (SCAN) …PASSED
Verification of SCAN was successful.
CVU operation performed: SCAN
Date: Oct 19, 2017 1:17:59 PM
CVU home: C:\…\grid_home\bin\..\
User: .\VFENOLL

Display the current configuration of the SCAN VIPs?

srvctl config scan
SCAN name: MY-CLUSTER-SCAN, Network: 1
Subnet IPv4: 10.104.2.0/255.255.255.0/Production, static
Subnet IPv6:
SCAN 1 IPv4 VIP: 10.404.2.677
SCAN VIP is enabled.
SCAN VIP is individually enabled on nodes:
SCAN VIP is individually disabled on nodes:
SCAN 2 IPv4 VIP: 10.404.2.618
SCAN VIP is enabled.
SCAN VIP is individually enabled on nodes:
SCAN VIP is individually disabled on nodes:
SCAN 3 IPv4 VIP: 10.404.2.619
SCAN VIP is enabled.
SCAN VIP is individually enabled on nodes:
SCAN VIP is individually disabled on nodes:

Display the status of SCAN VIPs and SCAN listeners?

srvctl status scan
SCAN VIP scan1 is enabled
SCAN VIP scan1 is running on node my-node1
SCAN VIP scan2 is enabled
SCAN VIP scan2 is running on node my-node2
SCAN VIP scan3 is enabled
SCAN VIP scan3 is running on node my-node1

If you want to add or modify a scan VIP: srvctl add | modify scan -n my-scan
To delete it: srvctl remove scan

Display the status of SCAN listeners?

srvctl status scan_listener
SCAN Listener LISTENER_SCAN1 is enabled
SCAN listener LISTENER_SCAN1 is running on node my-node1
SCAN Listener LISTENER_SCAN2 is enabled
SCAN listener LISTENER_SCAN2 is running on node my-node2
SCAN Listener LISTENER_SCAN3 is enabled
SCAN listener LISTENER_SCAN3 is running on node my-node1

If you want to add or remove a scan_listener: srvctl add | remove scan_listener
To change the port: srvctl modify scan_listener -p

Manage the Oracle Cluster Registry (OCR)


Verify the integrity of OCR?

cluvfy comp ocr -n all -verbose
Verifying OCR Integrity …PASSED
Verification of OCR integrity was successful.
CVU operation performed: OCR integrity
Date: Oct 11, 2017 4:56:01 PM
CVU home: C:\…grid_home\bin\..\
User: \VFENOLL

How to backup the OCR?

Oracle takes physical backup of OCR automatically every 3 hours. Default location is CRS_home/cdata/my_cluster_name/OCRBackup.
The ocrconfig tool is used to make daily copies of the automatically generated backup files.

Show backups:
ocrconfig -showbackup

Change default location of physical OCR copies:
ocrconfig -backuploc

After that, you have to copy these files on tape or in another backup location (cp -p -R CRS_home/cdata/my_cluster_name /u03/backups )

To do a manual backup:
ocrconfig -export /u03/backups/exports/OCR_exportBackup.dmp

How to recover OCR from physical or export backup?

Pre-requisite: All RAC components shutdow

Recover OCR from automatic physical backups:
crconfig -restore CRS_home/cdata/my_cluster_name/OCRBackup/backup00.ocr

Recover OCR from export backup:
ocrconfig -import /u03/backups/exports/OCR_exportBackup.dmp

How to backup the Voting disks?

In older versions of Oracle Clusterware you have to backup voting disks with the dd command.
Starting with Oracle Clusterware 11g Release 2 you no longer need to backup them. Voting disks are automatically backed up as a part of the OCR.

Manage database components


How to find the name of the database?

This name is useful as it is used in RAC commands with -d parameter.
With SQL*Plus:
connect / as sysdba
show parameter db_unique_name
With crsctl:
crsctl status resource -t | grep db

How to inspect the database configuration?

srvctl config database -d my-db-name
Database unique name: my-db-name
Database name: my-db-name
Oracle home: D:\oracle\db\product\12.2.0\dbhome_1
Oracle user: nt authority\system
Spfile: +DATA/my-db-name/PARAMETERFILE/spfile.272.9460543263
Password file: +DATA/my-db-name/PASSWORD/pwdmy-db-name.256.998734039
Domain:
Start options: open
Stop options: immediate
Database role: PRIMARY
Management policy: AUTOMATIC
Server pools:
Disk Groups: DATA,FRA
Mount point paths:
Services: my-db-name1,my-db-name2,srv1,srv2, srv3
Type: RAC
Start concurrency:
Stop concurrency:
Database instances: my-db-name1,my-db-name2
Configured nodes: node1,node2
CSS critical: no
CPU count: 0
Memory target: 0
Maximum memory: 0
Default network number for database services:
Database is administrator managed

Display name and the status of the instances in the RAC?

srvctl status database -d my-db-name
Instance my-db-name1 is running on node node1
Instance my-db-name2 is not running on node node2

To list just active nodes: olsnodes -s –t

How to start|stop the database?

srvctl stop database -d my-db-name -o immediate
srvctl start database -d my-db-name

How to start|stop one instance of the RAC?

srvctl start instance -d my-db-name -i my-db-name1
srvctl stop instance -d my-db-name -i my-db-name1
Use -force if the instance to stop is not on the local server

How to start and stop a PDB in Oracle RAC?

Stop a PDB

On the current node [or on all the nodes]:
ALTER PLUGGABLE DATABASE my-PDB-name CLOSE IMMEDIATE [Instances=all];
This will stop the associated service too.
Manually stopping the associated service will not close the PDB. You have to use this SQL command.

Start a PDB

On the current node [or on all the nodes]:
ALTER PLUGGABLE DATABASE my-PDB-name OPEN [Instances=all;]
You can also start the PDB with the associated service
This will NOT start the service(s) associated with this PDB.

How to stop and start a Listener?

srvctl stop listener -l LISTENER_NAME
srvctl start listener -l LISTENER_NAME

Jenkins installation steps

How to install Jenkins in linux.

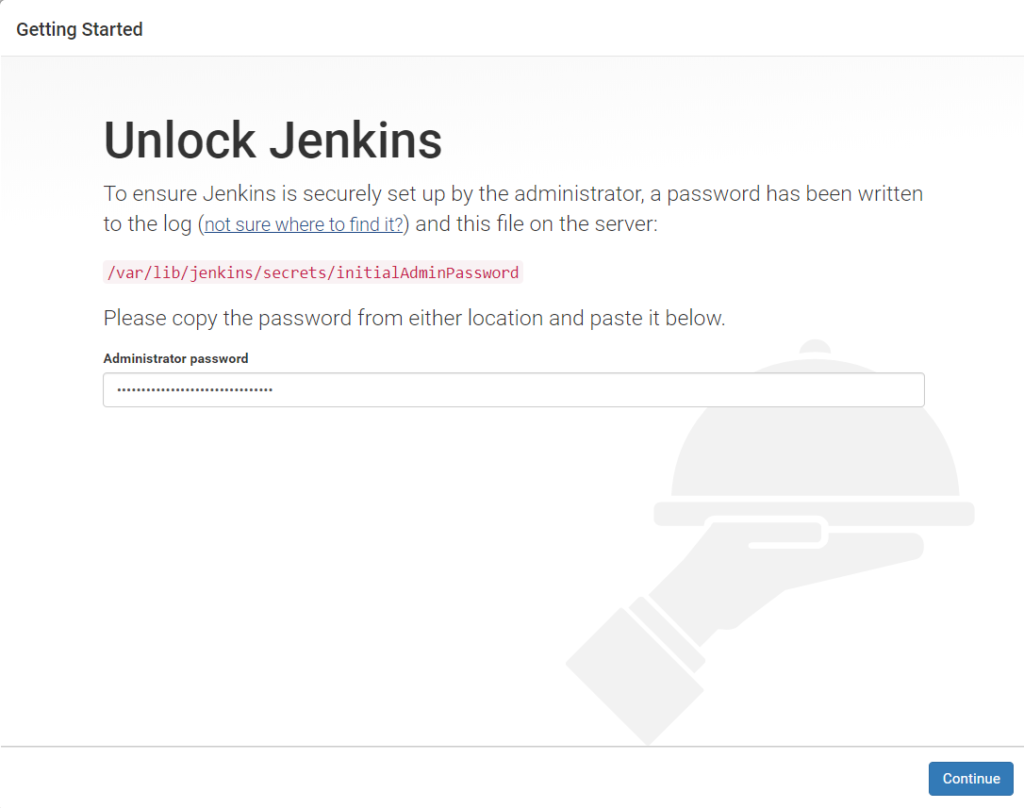
  1. Make sure Java’s latest version is installed or install the one.
  2. Download the Jenkins (
  3. Install the jenkins ( sudo
  4. Start the Jenkins (
  5. Make sure port 8080 (default) is open:
  6. Extract the ip address allocated to server:
  7. Access the Jenkins in url: ip:8080
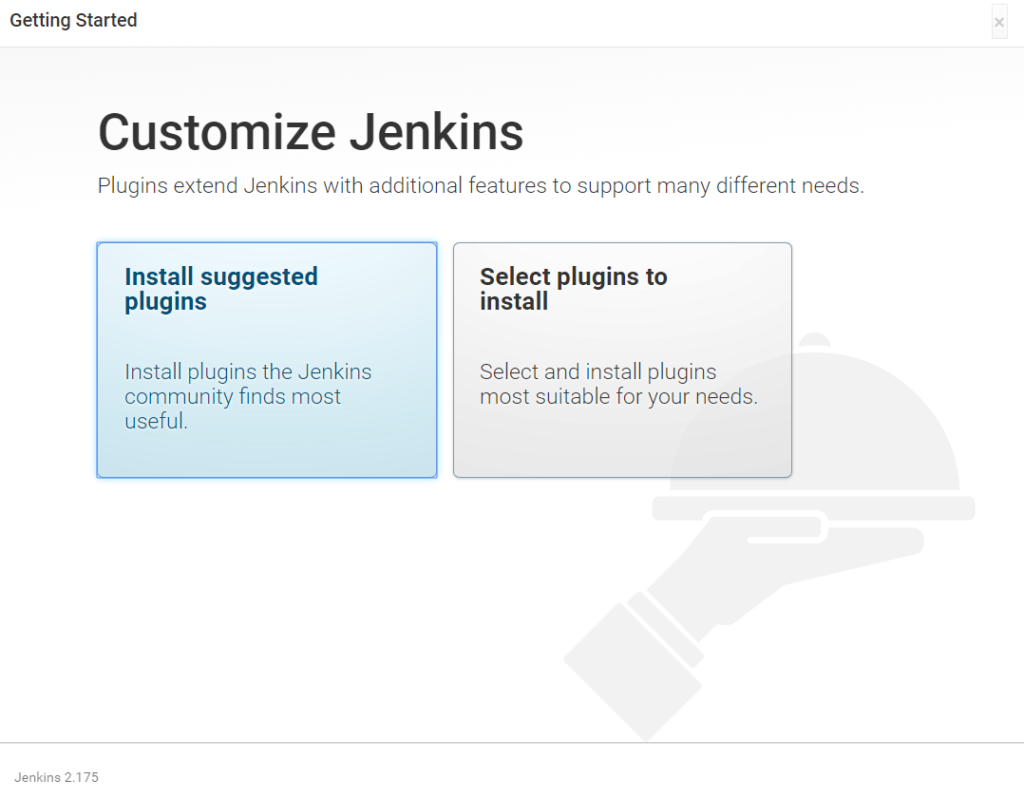
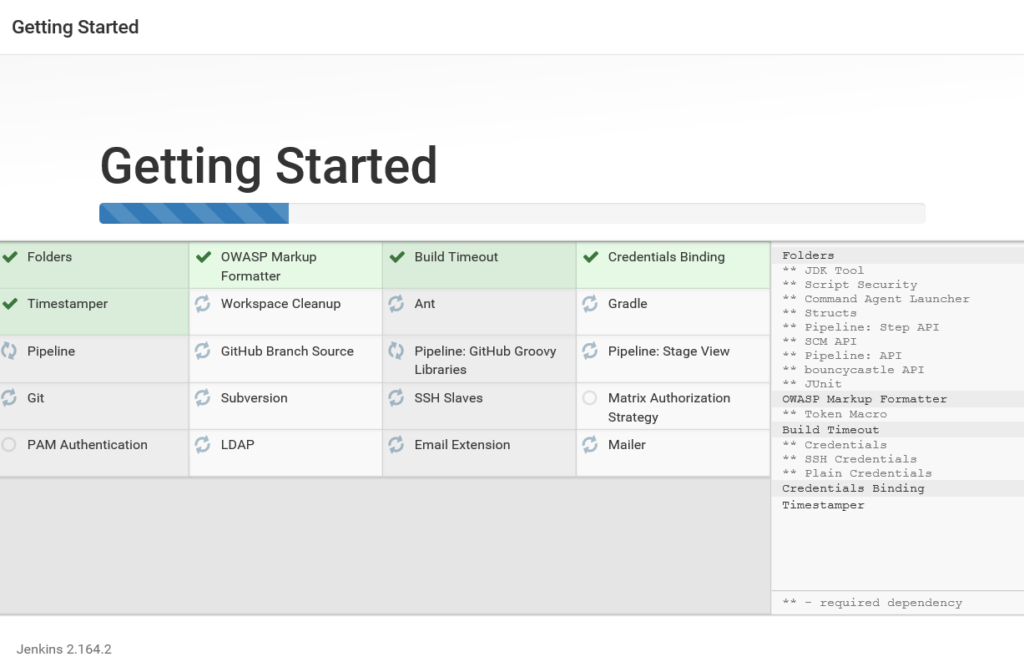
  8. Install the necessary plugins.

Install the necessary plugins

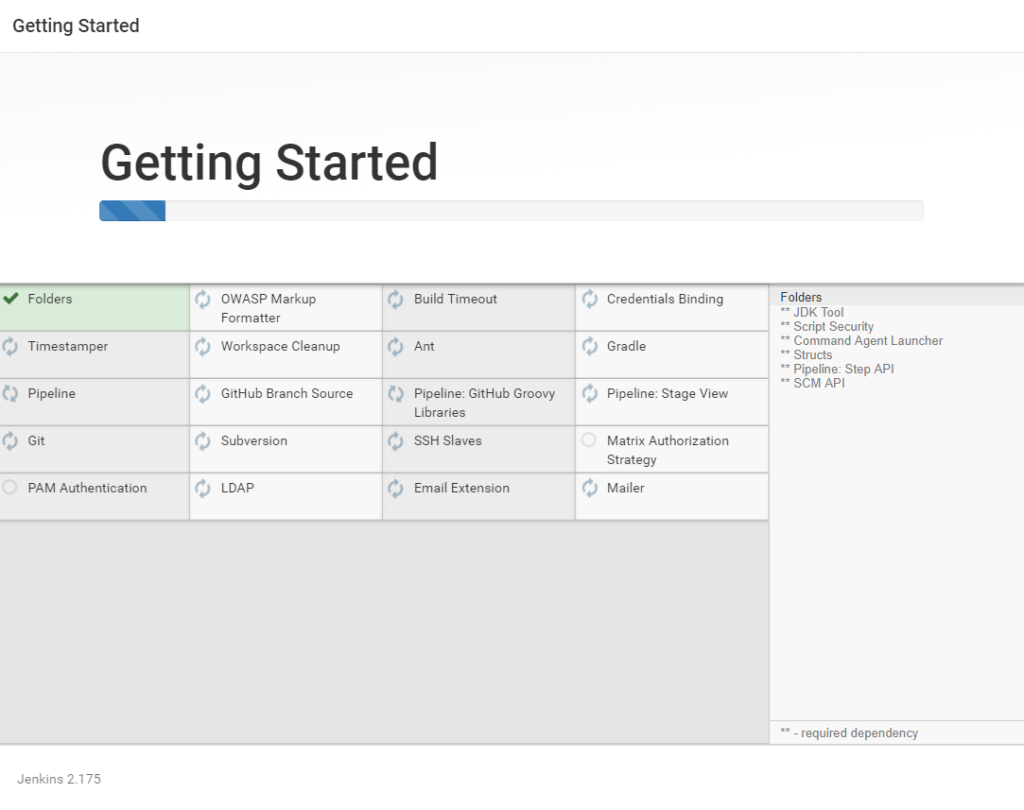
Plugin installation in progress.


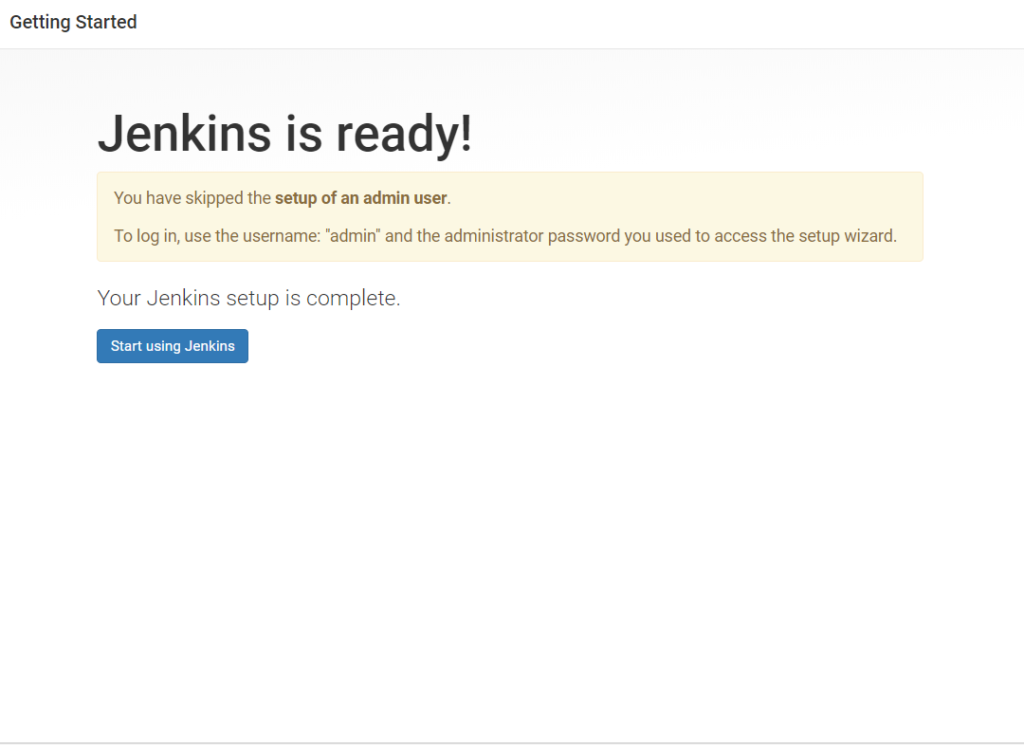
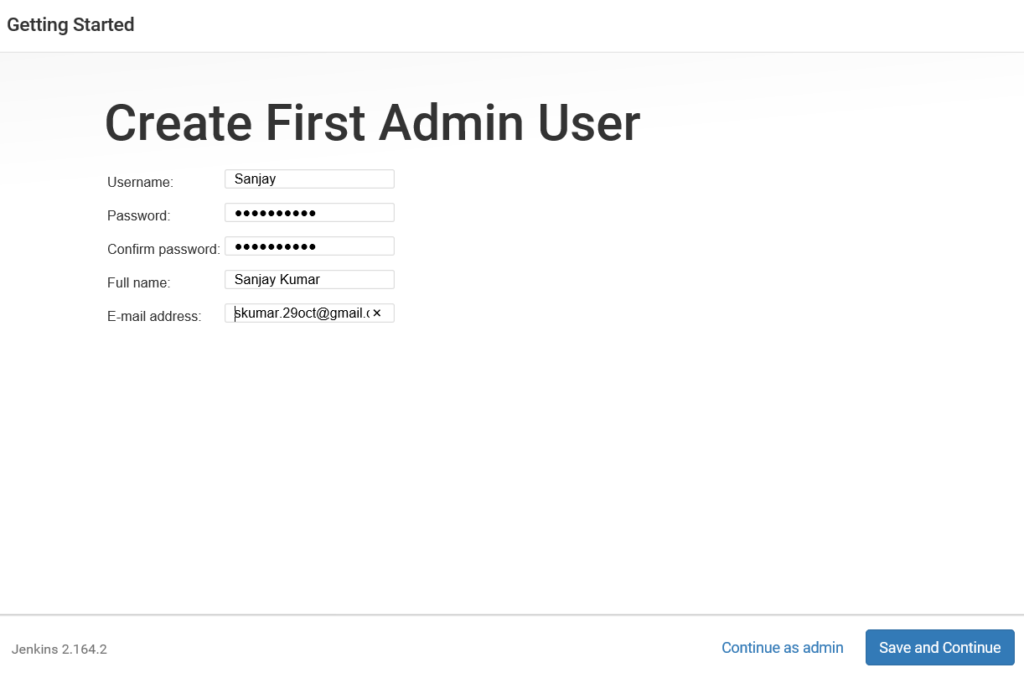
Once you will provide the admin/pwd and email etc. and click ‘Continue as admin’ Jenkins will be ready for use.

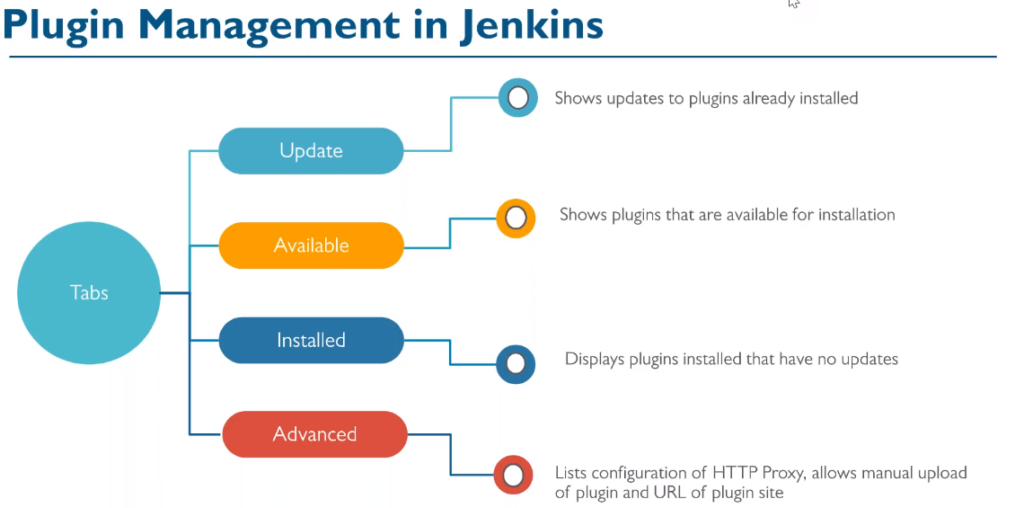
Jenkins plugins at a glance.

Jenkins installation

Pre-requisite for Jenkins installation on Windows, you must have java 8 or later.

In order to install the Jenkins on windows go to URL
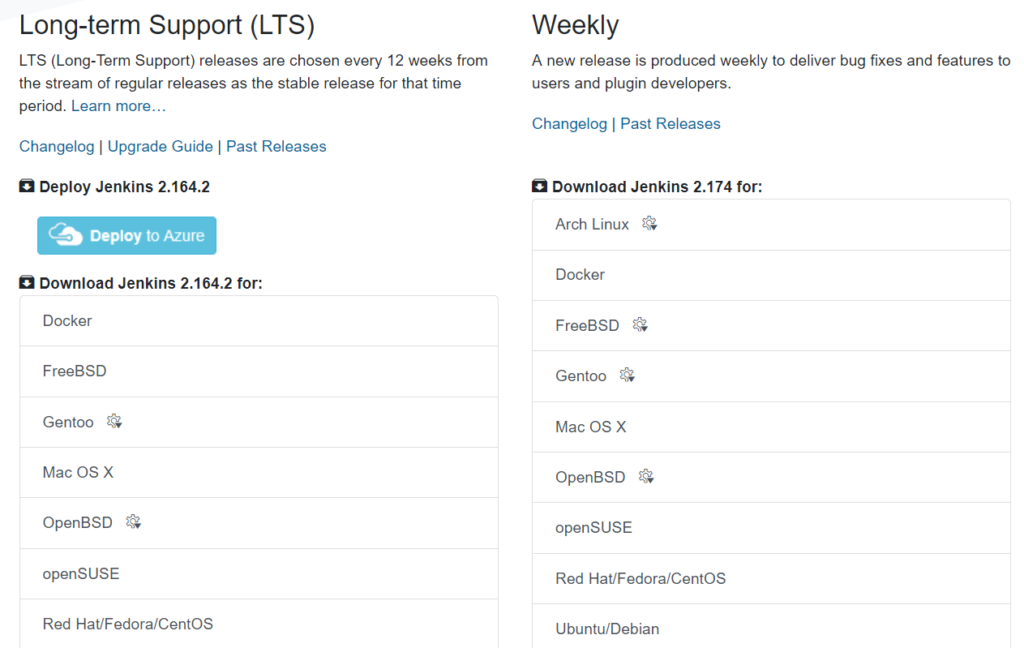
https://jenkins.io and click download. Now select ‘windows’ under the which one LTS or Weekly you want.

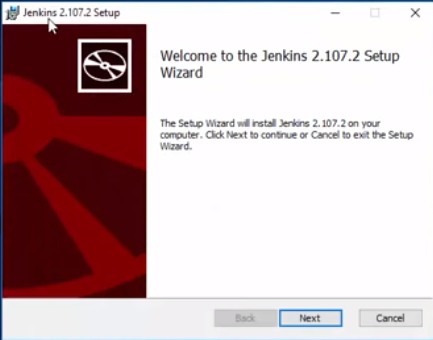
Click the downloaded zip file and it will launch the installation GUI.

Keep on clicking the next… and


Now choose the option you want. I would go for suggested plugins.

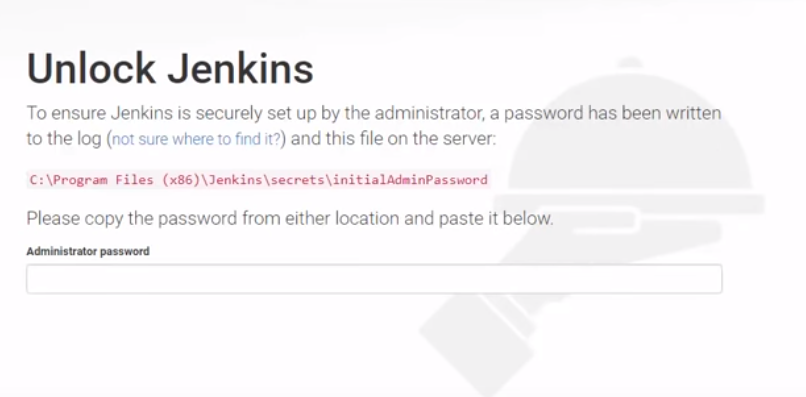
Once installation will be done you need to set up the admin details.

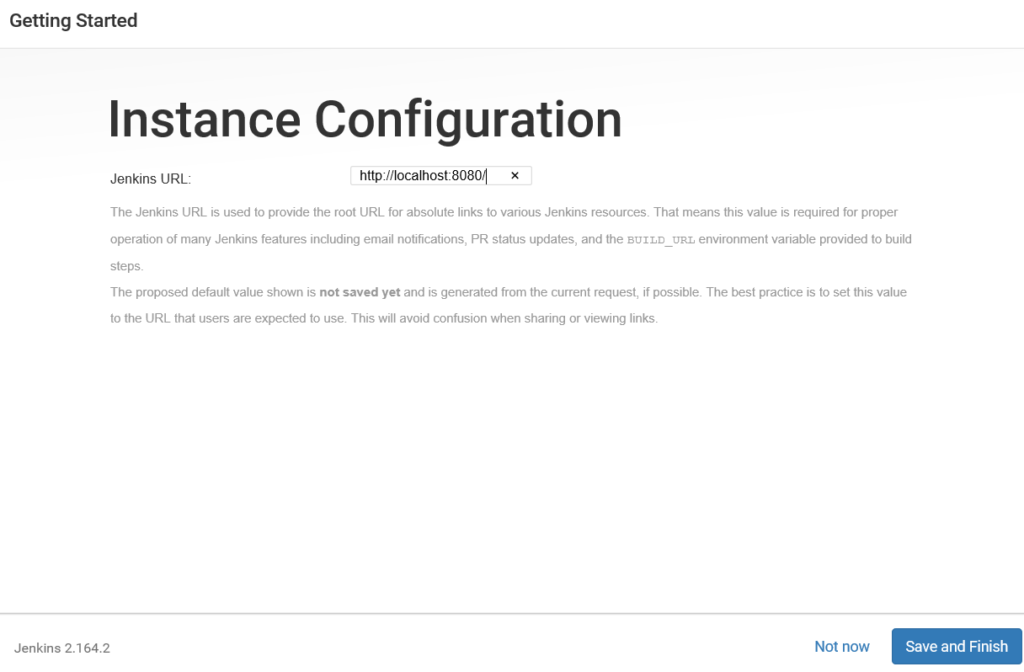
Make by default port is 8080 for Jenkins in windows, click save and finish.

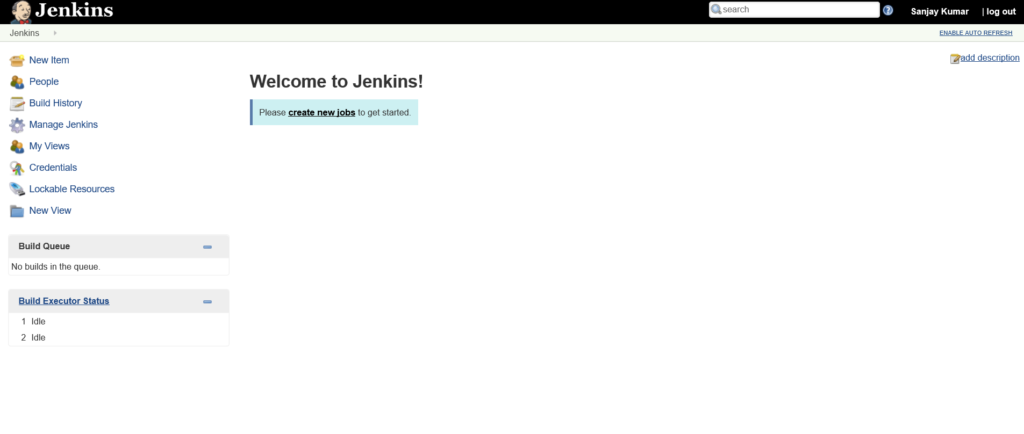
Here is your Jenkins ready for using

Here is the first screen once you login into Jenkins. Did you notice the Enable auto refresh button on the right side?

Primary and standby status

We can run following queries to check all are fine with Standby db.

       @Primary

set lines 500
column destination format a35 wrap
column process format a7
column archiver format a8
column ID format 99

select dest_id “ID”,destination,status,target,archiver,schedule,process,mountid from v$archive_dest;

Output (Status should return valid for standby destination)

ID DESTINATION STATUS TARGET ARCHIVER SCHEDULE PROCESS MOUNTID


1 /podaai/arch/PODAAI1/ VALID PRIMARY ARCH ACTIVE ARCH 0
2 podaai1_rmdc VALID STANDBY ARCH ACTIVE ARCH 0
3 INACTIVE PRIMARY ARCH INACTIVE ARCH 0
4 INACTIVE PRIMARY ARCH INACTIVE ARCH 0
5 INACTIVE PRIMARY ARCH INACTIVE ARCH 0
6 INACTIVE PRIMARY ARCH INACTIVE ARCH 0
7 INACTIVE PRIMARY ARCH INACTIVE ARCH 0
8 INACTIVE PRIMARY ARCH INACTIVE ARCH 0
9 INACTIVE PRIMARY ARCH INACTIVE ARCH 0
10 INACTIVE PRIMARY ARCH INACTIVE ARCH 0

column error format a55 tru
select dest_id,status,error from v$archive_dest;

Output (Should not return any error messages)

DEST_ID STATUS ERROR


     1 VALID
     2 VALID
     3 INACTIVE
     4 INACTIVE
     5 INACTIVE
     6 INACTIVE
     7 INACTIVE
     8 INACTIVE
     9 INACTIVE
    10 INACTIVE

column message format a80
select message, timestamp from v$dataguard_status where severity in (‘Error’,’Fatal’) order by timestamp;

Output (Should not return any rows)

SCP SYNTAX

scp PGEORI_2_23362*.arc rmohsgeor36.oracleoutsourcing.com:/pgeori/arch/PGEORI1

$ scp PCFITI_1_57371_604994162.arc rmohscfit03.oracleoutsourcing.com:/pcfiti/arch/
PCFITI_1_57371_604994162.arc

                               @Standby

select process,status,client_process,sequence#,block#,active_agents,known_agents from v$managed_standby;

Output (Should show MRP process up and running)

PROCESS STATUS CLIENT_P SEQUENCE# BLOCK# ACTIVE_AGENTS KNOWN_AGENTS


ARCH CONNECTED ARCH 0 0 0 0
RFS RECEIVING UNKNOWN 13491 36819 0 0
RFS RECEIVING UNKNOWN 13364 1810 0 0
RFS RECEIVING UNKNOWN 13493 38735 0 0
RFS RECEIVING UNKNOWN 13363 156 0 0
RFS ATTACHED UNKNOWN 13494 36989 0 0
RFS RECEIVING UNKNOWN 0 0 0 0
RFS RECEIVING UNKNOWN 13362 327 0 0

PROCESS STATUS CLIENT_P SEQUENCE# BLOCK# ACTIVE_AGENTS KNOWN_AGENTS


RFS ATTACHED UNKNOWN 13365 165 0 0
RFS RECEIVING UNKNOWN 13492 36686 0 0
MRP0 WAIT_FOR_LOG N/A 13493 0 0 0

column message format a80
select message, timestamp from v$dataguard_status where severity in (‘Error’,’Fatal’) order by timestamp;

Output (Should not return any rows)

Note: If we gets results as shown above, we can close the standby alerts as TFALSE.

Pls correct/ add comments if required.

To determine if there is an archive gap on your physical standby database, query
the as shown in the following example:

break on report
compute sum of GAP on report
select to_char(sysdate,’DD.MM.RR HH24:MI:SS’) time, a.thread#, (select
max(sequence#) from v$archived_log where archived’YES’ and thread#a.thread#)
archived, max(a.sequence#) applied, (select max(sequence#) from v$archived_log
where archived’YES’ and thread#a.thread#)-max(a.sequence#) gap from
v$archived_log a where a.applied’YES’ group by a.thread#;

To verify the log application status.

On primary DB

SELECT THREAD#, MAX(SEQUENCE#) AS “LAST_GENERATED_LOG” FROM V$LOG_HISTORY GROUP BY THREAD#;

Standby DB

SELECT THREAD#, MAX(SEQUENCE#) AS “LAST_APPLIED_LOG” FROM V$LOG_HISTORY GROUP BY THREAD#;

To see the max seq applied.

select THREAD#,max(SEQUENCE#) from v$archived_log where APPLIED’YES’ group by THREAD#;

To stop the MRP.

alter database recover managed standby database cancel;

To start the MRP.

recover managed standby database disconnect from session;

To recover standby manually.

SQL> recover automatic standby database;

SQL> recover managed standby database parallel

a. no. of cpu…
b. no. of thread possible on each cpu…

total threads a*b -1

To enable the in one commmand.

SQL> ALTER SYSTEM SET log_archive_dest_state_2enable scopeboth SID’*’ ;

To start the standby and put in MRP

SQL> startup nomount;

SQL> alter database mount standby database;

recover managed standby database disconnect from session ;

To find the missing logs @ standby

./autofs/cmd_ctr/database/missing_seq.sh
missing_seq.sh Parameter missing: missing_seq.sh low_seq high_seq thread#_if_rac
In case of Non Rac: missing_seq.sh 200 220 No need to give thread#
for Non Rac: missing_seq.sh 200 220 3 Here 3 is the thread#

set pagesize 10000
SELECT A., Round(A.Count#B.AVG#/1024/1024) Daily_Avg_Mb
FROM
(
SELECT thread#,
To_Char(First_Time,’YYYY-MM-DD’) DAY,
Count(1) Count#,
Min(RECID) Min#,
Max(RECID) Max#
FROM
gv$log_history
GROUP BY
thread#, To_Char(First_Time,’YYYY-MM-DD’)
ORDER
BY 2 DESC
) A,
(
SELECT Thread#,
Avg(BYTES) AVG#,
Count(1) Count#,
Max(BYTES) Max_Bytes,
Min(BYTES) Min_Bytes
FROM
gv$log group by thread#
) B where a.thread#b.thread#;

THREAD# DAY COUNT# MIN# MAX# DAILY_AVG_MB


     1 2010-03-24        113     133452     133564        14238
     1 2010-03-23        174     133278     133451        21924
     1 2010-03-22        182     133096     133277        22932
     1 2010-03-21        112     132984     133095        14112
     1 2010-03-20        145     132839     132983        18270
     1 2010-03-19        176     132663     132838        22176
     1 2010-03-18        200     132463     132662        25200
     1 2010-03-17        154     132309     132462        19404
     1 2010-03-16        164     132145     132308        20664
     1 2010-03-15         40     132105     132144         5040

Split a *.gz file and merge again in Linux or Windows.

This post will deal the situation where you have big size of dump of anything and you need to split that into smaller chunks than need to send over ftp/mail etc. After that need to regenerate the same it was before splitting.

Situation: I have a expdp dump of 35 GB, I need to send it via ftp mail which can accept maximum 1 GB file.

Solution:

NOTE: With below command you can expdp without sysdba pwd.

expdp \"/ as sysdba\" FLASHBACK_TIME=\"TO_TIMESTAMP\(TO_CHAR\(SYSDATE,\'YYYY-MM-DD HH24:MI:SS\'\),\'YYYY-MM-DD HH24:MI:SS\'\)\" full=y dumpfile=full_db.dmp logfile=full_db.log DIRECTORY=DATAPUMP_DIR compression=METADATA_ONLY version=latest PARALLEL=4

NOTE: Another way to expdp without password is as under.

expdp \'/ as sysdba\' directory=DATAPUMP_DIR full=y ...

1. Zip the existing dump.
gzip full_db.dmp

2. Split the .gz file into 1 GB files.
split -b 1024m “full_db.dmp.gz” “full_db.dmp.gz_01”

3. Send it using appropriate method like ftp, attachement etc.
ftp/mail etc.

4. Merge splitted files again
Linux: cat full_db.dmp.gz_01a* > full_db.dmp.gz
Windows: copy /b file1 + file2 + file3 + file4 filetogether

5. Unzip the file and now you are ready to do everything on this file, as it was in step 1.
Now unzip the compressed dump and it is ready to use.
gunzip full_db.dmp.gz

Solaris and AIX: prtconf command

prtconf command for Aix and Solaris operating systems.

It provide the information about below ones:

System model.
Machine serial number.
Processor type, number of processors and clock speed of processors.
Network information.
File system information.
Paging space information.
Devices information.
Total memory size.
To Gather General Machine Information

Using the command prtconf alone provides the whole information of machine.
The sample is given below. Some actual values have been replaced with other values for the sake of security.

ask-sanjay10: $ prtconf

To know what is the LPAR partition number and partition name use -L.

ask-sanjay10: $ prtconf -L

If its not LPAR, then “-1 NULL” will be returned.

To know the physical memory size of the machine use -m flag.
ask-sanjay10: $ prtconf -m

To know the Vital Product Data of all physical devices internal or attached to the machine, use -v option.
ask-sanjay10: $prtconf -v

Almost all of the information gathered by above commands is sn above in the output of prtconf command.

To Get The Processor Clock Speed

For this issue the command with -s parameter.
ask-sanjay10: $ prtconf -s

To Get CPU Type

To know if the cpu type is 32 bit or 64 bit, issue the command with -c parameter.
ask-sanjay10: $ prtconf -c

To Know The Type of Kenel bits
ask-sanjay10: $ prtconf -k

Unix: Performance commands at O.S.

Performance related commands iostat , vmstat

Introduction to iostat , vmstat and netstat

This document is primarily written with reference to solaris performance monitoring and tuning but these tools are available in other unix variants also with slight syntax difference.

iostat , vmstat and netstat are three most commonly used tools for performance monitoring . These comes built in with the operating system and are easy to use .iostat stands for input output statistics and reports statistics for i/o devices such as disk drives . vmstat gives the statistics for virtual Memory and netstat gives the network statstics .

Following paragraphs describes these tools and their usage for performance monitoring.

Table of content :
1. Iostat
* Syntax
* example
* Result and Solutions

2. vmstat
* syntax
* example
* Result and Solutions

3. netstat
* syntax
* example
* Result and Solutions

Input Output statistics ( iostat )

iostat reports terminal and disk I/O activity and CPU utilization. The first line of output is for the time period since boot & each subsequent line is for the prior interval . Kernel maintains a number of counters to keep track of the values.

iostat’s activity class options default to tdc (terminal, disk, and CPU). If any other option/s are specified, this default is completely overridden i.e. iostat -d will report only statistics about the disks.

syntax:
Basic synctax is iostat interval count
option – let you specify the device for which information is needed like disk , cpu or terminal. (-d , -c , -t or -tdc ) . x options gives the extended statistics .

interval – is time period in seconds between two samples . iostat 4 will give data at each 4 seconds interval.

count – is the number of times the data is needed . iostat 4 5 will give data at 4 seconds interval 5 times

Example
$ iostat -xtc 10 5

extended disk statistics tty cpu
disk r/s w/s Kr/s Kw/s wait actv svc_t %w %b tin tout us sy wt id
sd0 2.6 3.0 20.7 22.7 0.1 0.2 59.2 6 19 0 84 3 85 11 0
sd1 4.2 1.0 33.5 8.0 0.0 0.2 47.2 2 23
sd2 0.0 0.0 0.0 0.0 0.0 0.0 0.0 0 0
sd3 10.2 1.6 51.4 12.8 0.1 0.3 31.2 3 31

The fields have the following meanings:
disk name of the disk
r/s reads per second
w/s writes per second
Kr/s kilobytes read per second
Kw/s kilobytes written per second
wait average number of transactions waiting for service (Q length)
actv average number of transactions actively being serviced
(removed from the queue but not yet completed)
%w percent of time there are transactions waiting
for service (queue non-empty)
%b percent of time the disk is busy (transactions
in progress)
Results and Solutions
The values to look from the iostat output are:
* Reads/writes per second (r/s , w/s)
* Percentage busy (%b)
* Service time (svc_t)

If a disk shows consistently high reads/writes along with , the percentage busy (%b) of the disks is greater than 5 percent, and the average service time (svc_t) is greater than 30 milliseconds, then one of the following action needs to be taken

1.) Tune the application to use disk i/o more efficiently by modifying the disk queries and using available cache facilities of application servers .

2.) Spread the file system of the disk on to two or more disk using disk striping feature of volume manager /disksuite etc.

3.) Increase the system parameter values for inode cache , ufs_ninode , which is Number of inodes to be held in memory. Inodes are cached globally (for UFS), not on a per-file system basis

4.) Move the file system to another faster disk /controller or replace existing disk/controller to a faster one.
Virtual Memory Statistics ( vmstat )

vmstat

vmstat reports virtual memory statistics of process, virtual memory, disk, trap, and CPU activity.

On multicpu systems , vmstat averages the number of CPUs into the output. For per-process statistics .Without options, vmstat displays a one-line summary of the virtual memory activity since the system was booted.

syntax
Basic synctax is vmstat interval count

option – let you specify the type of information needed such as paging -p , cache -c ,.interrupt -i etc.

if no option is specified information about process , memory , paging , disk ,interrupts & cpu is displayed .

interval – is time period in seconds between two samples . vmstat 4 will give data at each 4 seconds interval.

count – is the number of times the data is needed . vmstat 4 5 will give data at 4 seconds interval 5 times.

Example
The following command displays a summary of what the system
is doing every five seconds.

# vmstat 5

procs memory page disk faults cpu
r b w swap free re mf pi p fr de sr s0 s1 s2 s3 in sy cs us sy id
0 0 0 11456 4120 1 41 19 1 3 0 2 0 4 0 0 48 112 130 4 14 82
0 0 1 10132 4280 0 4 44 0 0 0 0 0 23 0 0 211 230 144 3 35 62
0 0 1 10132 4616 0 0 20 0 0 0 0 0 19 0 0 150 172 146 3 33 64
0 0 1 10132 5292 0 0 9 0 0 0 0 0 21 0 0 165 105 130 1 21 78

The fields of vmstat’s display are
procs
r in run queue
b blocked for resources I/O, paging etc.
w swapped
memory (in Kbytes)
swap – amount of swap space currently available
free – size of the free list

page ( in units per second).
re page reclaims – see -S option for how this
field is modified.
mf minor faults – see -S option for how this
field is modified.
pi kilobytes paged in
po kilobytes paged out
fr kilobytes freed
de anticipated short-term memory shortfall (Kbytes)
sr pages scanned by clock algorithm
disk ( operations per second )
There are slots for up to four disks,
labeled with a single letter and number.
The letter indicates the type of disk
(s = SCSI, i = IPI, etc).
The number is the logical unit number.

faults
in (non clock) device interrupts
sy system calls
cs CPU context switches

cpu – breakdown of percentage usage of CPU time.
On multiprocessors this is an a
average across all processors.
us user time
sy system time
id idle time
Results and Solution from iostat

A. CPU issues
Following columns has to be watched to determine if there is any cpu issue

1. Processes in the run queue (procs r)
2. User time (cpu us)
3. System time (cpu sy)
4. Idle time (cpu id)

procs cpu
r b w us sy id
0 0 0 4 14 82
0 0 1 3 35 62
0 0 1 3 33 64
0 0 1 1 21 78
Problem symptoms

A.) Number of processes in run queue
1.) If the number of processes in run queue (procs r) are consistently greater than the number of CPUs on the system it will slow down system as there are more processes then available CPUs .
2.) if this number is more than four times the number of available CPUs in the system then system is facing shortage of cpu power and will greatly slow down the processess on the system.
3.) If the idle time (cpu id) is consistently 0 and if the system time (cpu sy) is double the user time (cpu us) system is facing shortage of CPU resources.

Resolution
Resolution to these kind of issues involves tuning of application procedures to make efficient use of cpu and as a last resort increasing the cpu power or adding more cpu to the system.

B. Memory Issues
Memory bottlenecks are determined by the scan rate (sr) . The scan rate is the pages scanned by the clock algorithm per second. If the scan rate (sr) is continuously over 200 pages per second then there is a memory shortage.

Resolution
1. Tune the applications & servers to make efficient use of memory and cache.
2. Increase system memory .
3. Implement priority paging in s in pre solaris 8 versions by adding line “set priority paging=1? in
/etc/system. Remove this line if upgrading from Solaris 7 to 8 & retaining old /etc/system file.

Unix: Network Statistics (netstat)

Network Statistics (netstat)

netstat displays the contents of various network-related data structures in depending on the options selected.

Syntax

netstat
multiple options can be given at one time.

Options
-a – displays the state of all sockets.
-r – shows the system routing tables
-i – gives statistics on a per-interface basis.
-m – displays information from the network memory buffers. On Solaris, this shows statistics for STREAMS
-p [proto] – retrieves statistics for the specified protocol
-s – shows per-protocol statistics. (some implementations allow -ss to remove fileds with a value of 0 (zero) from the display.)
-D – display the status of DHCP configured interfaces.
-n do not lookup hostnames, display only IP addresses.
-d (with -i) displays dropped packets per interface.
-I [interface] retrieve information about only the specified interface.
-v be verbose

interval – number for continuous display of statictics.

Example

$netstat -rn

Routing Table: IPv4
Destination Gateway Flags Ref Use Interface
——————– ——————– —– —– —— ———
192.168.1.0 192.168.1.11 U 1 1444 le0
224.0.0.0 192.168.1.11 U 1 0 le0
default 192.168.1.1 UG 1 68276
127.0.0.1 127.0.0.1 UH 1 10497 lo0
This shows the output on a Solaris machine who’s IP address is 192.168.1.11 with a default router at 192.168.1.1

Results and Solutions

A.) Network availability
The command as above is mostly useful in troubleshooting network accessibility issues . When outside network is not accessible from a machine check the following

1. if the default router ip address is correct
2. you can ping it from your machine.
3. If router address is incorrect it can be changed with route add command. See man route for more information.

route command examples
$route add default
$route add 192.0.2.32

If the router address is correct but still you can’t ping it there may be some network cable /hub/switch problem and you have to try and eliminate the faulty component .

B.) Network Response
$ netstat -i

Name Mtu Net/Dest Address Ipkts Ierrs Opkts Oerrs Collis Queue
lo0 8232 loopback localhost 77814 0 77814 0 0 0
hme0 1500 server1 server1 10658 3 48325 0 279257 0
This option is used to diagnose the network problems when the connectivity is there but it is slow in response .

Values to look at:

* Collisions (Collis)
* Output packets (Opkts)
* Input errors (Ierrs)
* Input packets (Ipkts)

The above values will give information to workout

i. Network collision rate as follows :

Network collision rate = Output collision counts / Output packets

Network-wide collision rate greater than 10 percent will indicate

* Overloaded network,
* Poorly configured network,
* Hardware problems.

ii. Input packet error rate as follows :

Input Packet Error Rate = Ierrs / Ipkts.

If the input error rate is high (over 0.25 percent), the host is dropping packets. Hub/switch cables etc needs to be checked for potential problems.

C. Network socket & TCP Connection state

Netstat gives important information about network socket and tcp state . This is very useful in
finding out the open , closed and waiting network tcp connection .

Network states returned by netstat are following

CLOSED —- Closed. The socket is not being used.
LISTEN —- Listening for incoming connections.
SYN_SENT —- Actively trying to establish connection.
SYN_RECEIVED —- Initial synchronization of the connection under way.
ESTABLISHED —- Connection has been established.
CLOSE_WAIT —- Remote shut down; waiting for the socket to close.
FIN_WAIT_1 —- Socket closed; shutting down connection.
CLOSING —- Closed,
then remote shutdown; awaiting acknowledgement.
LAST_ACK —- Remote shut down, then closed ;awaiting acknowledgement.
FIN_WAIT_2 —- Socket closed; waiting for shutdown from remote.
TIME_WAIT —- Wait after close for remote shutdown retransmission..
Example
#netstat -a

Local Address Remote Address Swind Send-Q Rwind Recv-Q State
*.* *.* 0 0 24576 0 IDLE
*.22 *.* 0 0 24576 0 LISTEN
*.* *.* 0 0 24576 0 IDLE
*.32771 *.* 0 0 24576 0 LISTEN
*.4045 *.* 0 0 24576 0 LISTEN
*.25 *.* 0 0 24576 0 LISTEN
*.5987 *.* 0 0 24576 0 LISTEN
*.898 *.* 0 0 24576 0 LISTEN
*.32772 *.* 0 0 24576 0 LISTEN
*.32775 *.* 0 0 24576 0 LISTEN
*.32776 *.* 0 0 24576 0 LISTEN
*.* *.* 0 0 24576 0 IDLE
192.168.1.184.22 192.168.1.186.50457 41992 0 24616 0 ESTABLISHED
192.168.1.184.22 192.168.1.186.56806 38912 0 24616 0 ESTABLISHED
192.168.1.184.22 192.168.1.183.58672 18048 0 24616 0 ESTABLISHED
if you see a lots of connections in FIN_WAIT state tcp/ip parameters have to be tuned because the
connections are not being closed and they gets accumulating . After some time system may run out of
resource . TCP parameter can be tuned to define a time out so that connections can be released and used by new connection.

Windows commands in nutshell

Here is the quick summary and few commands are in details:

1. nslookup
The nslookup tool can help you to verify that DNS name resolution is working correctly. When you run nslookup against a host name, the tool will show you how the name was resolved, as well as which DNS server was used during the lookup. This tool can be extremely helpful when troubleshooting problems related to legacy DNS records that still exist but that are no longer correct.
To use this tool, just enter the nslookup command, followed by the name of the host you want to resolve. For example:
C:\Users\Sanjay.Kumar>nslookup ask-sanjay.com
Server: vsresolverdns.atl3.dc.sita.aero
Address: 10.213.200.50
Non-authoritative answer:
Name: ask-sanjay.com
Address: 103.247.96.231
C:\Users\Sanjay.Kumar>
2. ping
Ping is probably the simplest of all diagnostic commands. It’s used to verify basic TCP/IP connectivity to a network host. To use it, simply enter the command, followed by the name or IP address of the host you want to test. For example:
Keep in mind that this command will work only if Internet Control Message Protocol (ICMP) traffic is allowed to pass between the two machines. If at any point a firewall is blocking ICMP traffic, the ping will fail.

C:\Users\Sanjay.Kumar>ping ask-sanjay.com
Pinging ask-sanjay.com [103.247.96.231] with 32 bytes of data:
Reply from 103.247.96.231: bytes=32 time=141ms TTL=44
Reply from 103.247.96.231: bytes=32 time=162ms TTL=44
Reply from 103.247.96.231: bytes=32 time=176ms TTL=44
Reply from 103.247.96.231: bytes=32 time=195ms TTL=44

Ping statistics for 103.247.96.231:
Packets: Sent = 4, Received = 4, Lost = 0 (0% loss),
Approximate round trip times in milli-seconds:
Minimum = 141ms, Maximum = 195ms, Average = 168ms
3. tasklist
The tasklist command is designed to provide information about the tasks that are running on a Windows 7 system. At its most basic, you can enter the following command:
tasklist
The tasklist command has numerous option. One is the -m switch, which causes tasklist to display all the DLL modules associated with a task. The other is the -svc switch, which lists the services that support each task. Here’s how they look:
tasklist -m
tasklist -svc
4. taskkill
The taskkill command terminates a task, either by name (which is referred to as the image name) or by process ID. You can follow the taskkill command with -pid (process ID) or image nameand the name or process ID of the task that you want to terminate. Here are two examples of how this command works:
taskkill -pid 4934
taskkill -im iexplore.exe

5. telnet
Telnet ask-sanjay.com
NOTE: If telnet package is not installed on your system. You can install it by using below command
pkgmgr /iu:”TelnetClient”

NOTE: You may need to restart cmd to get it into affect.

6. tnsping
tnsping <service_name_having_entry_in_your_tnsnames.ora>
Used TNSNAMES adapter to resolve the alias
Attempting to contact (DESCRIPTION = (ADDRESS = (PROTOCOL = TCP)(HOST = hostname)(PORT = 1521)) (CONNECT_DATA = (SERVER = DEDICATED) (SERVICE_NAME = Name_of_Service)))
OK (1050 msec)

C:\Users\Sanjay.Kumar>
C:\Users\Sanjay.Kumar>tnsping v_ref_vsvxs1d

TNS Ping Utility for 64-bit Windows: Version 11.1.0.7.0 – Production on 01-FEB-2013 10:43:09

Copyright (c) 1997, 2008, Oracle. All rights reserved.

Used parameter files:
C:\app\sanjay.kumar\product\11.1.0\db_1\network\admin\sqlnet.ora

C:\Users\Sanjay.Kumar>help
For more information on a specific command, type HELP command-name
ASSOC                            Displays or modifies file extension associations.
ATTRIB                         Displays or changes file attributes.
BREAK                           Sets or clears extended CTRL+C checking.
BCDEDIT                       Sets properties in boot database to control boot loading.
CACLS                            Displays or modifies access control lists (ACLs) of files.
CALL                              Calls one batch program from another.
CD                                   Displays the name of or changes the current directory.
CHCP                             Displays or sets the active code page number.
CHDIR                          Displays the name of or changes the current directory.
CHKDSK                       Checks a disk and displays a status report.
CHKNTFS                    Displays or modifies the checking of disk at boot time.
CLS                                Clears the screen.
CMD                              Starts a new instance of the Windows command interpreter.
COLOR                          Sets the default console foreground and background colors.
COMP                            Compares the contents of two files or sets of files.
COMPACT                    Displays or alters the compression of files on NTFS partitions.
CONVERT                    Converts FAT volumes to NTFS. You cannot convert thecurrent drive.
COPY                             Copies one or more files to another location.
DATE                             Displays or sets the date.
DEL                                 Deletes one or more files.
DIR                                 Displays a list of files and subdirectories in a directory.
DISKCOMP                  Compares the contents of two floppy disks.
DISKCOPY                   Copies the contents of one floppy disk to another.
DISKPART                   Displays or configures Disk Partition properties.
DOSKEY                        Edits command lines, recalls Windows commands, and creates macros.
DRIVERQUERY         Displays current device driver status and properties.
ECHO                             Displays messages, or turns command echoing on or off.
ENDLOCAL                  Ends localization of environment changes in a batch file.
ERASE                           Deletes one or more files.
EXIT                               Quits the CMD.EXE program (command interpreter).
FC                                    Compares two files or sets of files, and displays the differences between them.
FIND                              Searches for a text string in a file or files.
FINDSTR                      Searches for strings in files.
FOR                                Runs a specified command for each file in a set of files.
FORMAT                      Formats a disk for use with Windows.
FSUTIL                        Displays or configures the file system properties.
FTYPE                          Displays or modifies file types used in file extension associations.
GOTO                           Directs the Windows command interpreter to a labeled line in a batch program.
GPRESULT                Displays Group Policy information for machine or user.
GRAFTABL               Enables Windows to display an extended character set in graphics mode.
HELP                           Provides Help information for Windows commands.
ICACLS                       Display, modify, backup, or restore ACLs for files and directories.
IF                                  Performs conditional processing in batch programs.
LABEL                        Creates, changes, or deletes the volume label of a disk.
MD                               Creates a directory.
MKDIR                       Creates a directory.
MKLINK                    Creates Symbolic Links and Hard Links
MODE                         Configures a system device.
MORE                         Displays output one screen at a time.
MOVE                         Moves one or more files from one directory to another directory.
OPENFILES              Displays files opened by remote users for a file share.
PATH                          Displays or sets a search path for executable files.
PAUSE                        Suspends processing of a batch file and displays a message.
POPD                           Restores the previous value of the current directory saved by PUSHD.
PRINT                        Prints a text file.
PROMPT                    Changes the Windows command prompt.
PUSHD                       Saves the current directory then changes it.
RD                                Removes a directory.
RECOVER                 Recovers readable information from a bad or defective disk.
REM                            Records comments (remarks) in batch files or CONFIG.SYS.
REN                             Renames a file or files.
RENAME                   Renames a file or files.
REPLACE                  Replaces files.
RMDIR                       Removes a directory.
ROBOCOPY              Advanced utility to copy files and directory trees
SET                             Displays, sets, or removes Windows environment variables.
SETLOCAL               Begins localization of environment changes in a batch file.
SC                               Displays or configures services (background processes).
SCHTASKS             Schedules commands and programs to run on a computer.
SHIFT                      Shifts the position of replaceable parameters in batch files.
SHUTDOWN          Allows proper local or remote shutdown of machine.
SORT                        Sorts input.
START                     Starts a separate window to run a specified program or command.
SUBST                     Associates a path with a drive letter.
SYSTEMINFO     Displays machine specific properties and configuration.
TASKLIST            Displays all currently running tasks including services.
TASKKILL           Kill or stop a running process or application.
TIME                     Displays or sets the system time.
TITLE                   Sets the window title for a CMD.EXE session.
TREE                     Graphically displays the directory structure of a drive or path.
TYPE                     Displays the contents of a text file.
VER                        Displays the Windows version.
VERIFY               Tells Windows whether to verify that your files are written correctly to a disk.
VOL                       Displays a disk volume label and serial number.
XCOPY                 Copies files and directory trees.
WMIC                  Displays WMI information inside interactive command shell.
For more information on tools see the command-line reference in the online help.

Here is the list full list from microsoft